Pcr&pls
Performing Principal Components Regression (PCR) and Partial Least Squares Regression (PLS) in R
For UBER’s dataset
library(tidyverse)
library(caret)
library(pls)
Principal Components Regression
set.seed(45)
pub1 <- train(
    price~., data = trainub, method = "pcr",
    scale = F, trControl = trainControl("cv", number = 10),
    tuneLength = 10)
Plot model RMSE vs different values of components
plot(pub1, main= 'Principal component regression: Uber')
Here’s the PCR plot for Uber:
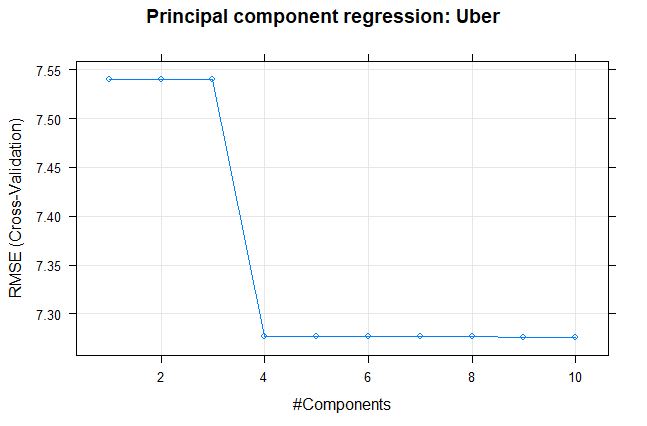
Print the best tuning parameter ncomp that minimize the cross-validation error, RMSE
pub1$bestTune
summary(pub1$finalModel)
set.seed(45)
pcr_pub2 <- train(
    price~., data = trainub, method = "pcr",
    scale = F, trControl = trainControl("cv", number = 10),
    tuneLength = 5)
Make predictions for the PCR
pcr_ubpred <- pcr_pub2 %>% predict(testub)
# Model performance metrics
data.frame(
    RMSE = caret::RMSE(pcr_ubpred, testub$price),
    Rsquare = caret::R2(pcr_ubpred, testub$price))
Partial Least Squares Regression
set.seed(45)
plsub2 <- train(
    price~., data = trainub, method = "pls",
    scale = F,
    trControl = trainControl("cv", number = 10),
    tuneLength = 10)
Plot model RMSE vs different values of components
plot(plsub2, main= 'Partial least squares: Uber')
Here’s the PLS plot for Uber:
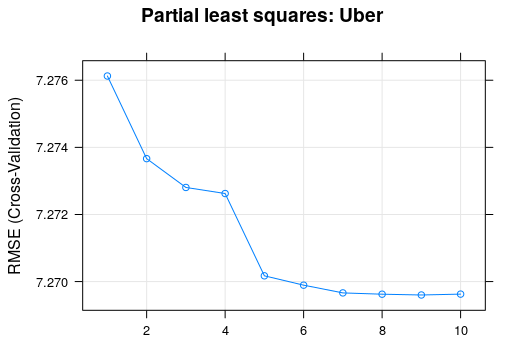
Print the best tuning parameter ncomp that minimize the cross-validation error, RMSE
plsub2$bestTune
summary(plsub2$finalModel)
plsly_sel <- train(
    price~., data = trainub, method = "pls",
    scale = F,
    trControl = trainControl("cv", number = 10),
    tuneLength = 6)
Make predictions for the PLS
predpls2 <- plsly_sel %>% predict(testub)
Model performance metrics
data.frame(
    RMSE = caret::RMSE(predpls2, testub$price),
    Rsquare = caret::R2(predpls2, testub$price)
)
For LYFT’s dataset
Principal Components Regression
set.seed(45)
pcrly <- train(
    price~., data = trainly, method = "pcr",
    scale = F, trControl = trainControl("cv", number = 10),
    tuneLength = 10)
Plot model RMSE vs different values of components
plot(pcrly, main= 'Principal component regression: Lyft')
Here’s the PCR plot for Lyft:

Print the best tuning parameter ncomp that minimize the cross-validation error, RMSE
pcrly$bestTune
summary(pcrly$finalModel)
set.seed(45)
pcrly_sel <- train(
    price~., data = trainly, method = "pcr",
    scale = T, trControl = trainControl("cv", number = 4),
    tuneLength = 4)
Make predictions the PCR
pcr_predly <- pcrly_sel %>% predict(testly)
Model performance metrics
data.frame(
    RMSE = caret::RMSE(pcr_predly, testly$price),
    Rsquare = caret::R2(pcr_predly, testly$price))
Partial Least Squares
set.seed(45)
plsly <- train(
    price~., data = trainly, method = "pls",
    scale = F,
    trControl = trainControl("cv", number = 10),
    tuneLength = 10)
Plot model RMSE vs different values of components
plot(plsly, main= 'Partial least squares: Lyft')
Here’s the PLS plot for Lyft:
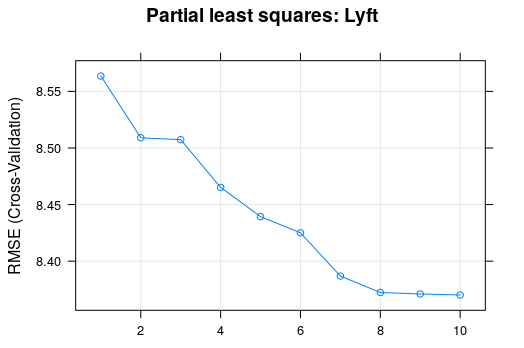
Print the best tuning parameter ncomp that minimize the cross-validation error, RMSE
plsly$bestTune
summary(plsly$finalModel)
Make predictions for the PLS
set.seed(45)
plsly_sel <- train(
    price~., data = trainly, method = "pls",
    scale = F, trControl = trainControl("cv", number = 10),
    tuneLength = 7)
predplsly <- plsly_sel %>% predict(testly)
Model performance metrics
data.frame(
    RMSE = caret::RMSE(predplsly, testly$price),
    Rsquare = caret::R2(predplsly, testly$price)
)
par(mfrow=c(1,2))
plot(plsub2, main= 'Partial least squares: Uber')
plot(plsly, main= 'Partial least squares: Lyft')
Make predictions for the PLS
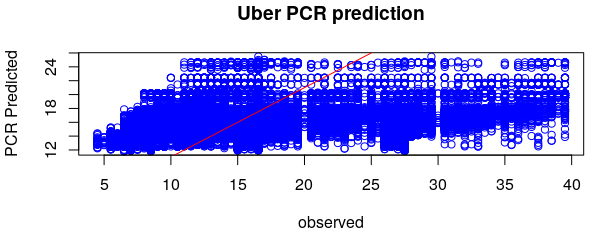
pcr.pred = predict(pub1, testub, ncomp=4)
plot(testub$price, pcr.pred, main="Uber PCR prediction", col='blue',
     xlab="observed", ylab="PCR Predicted")
abline(1, 1, col="red")
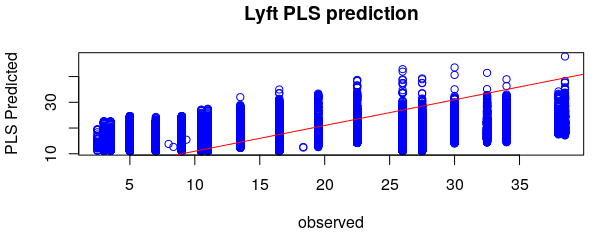
pls.pred = predict(plsly, testly, ncomp=7)
plot(testly$price, pls.pred, main="Lyft PLS prediction", col='blue',
     xlab="observed", ylab="PLS Predicted")
abline(1, 1, col="red")
This is the end of part 2.